Most teams managing inventory without a system treat every SKU roughly the same. They reorder based on gut feel, check stock when something runs low, and spend equal time on items that matter very differently to the business.
That approach works at 20 SKUs. It breaks down fast at 200.
ABC analysis is an inventory categorization method that divides stock into three groups - A, B, and C - based on value and consumption rate. A items are high-value or fast-moving. C items are low-value or slow-moving. The method helps teams focus time, budget, and reorder attention on the items that have the most impact on operations.
The logic comes from the Pareto principle: roughly 20% of stock typically accounts for 80% of inventory value or sales volume. ABC analysis makes that 20% visible and actionable.
How ABC Classification Works
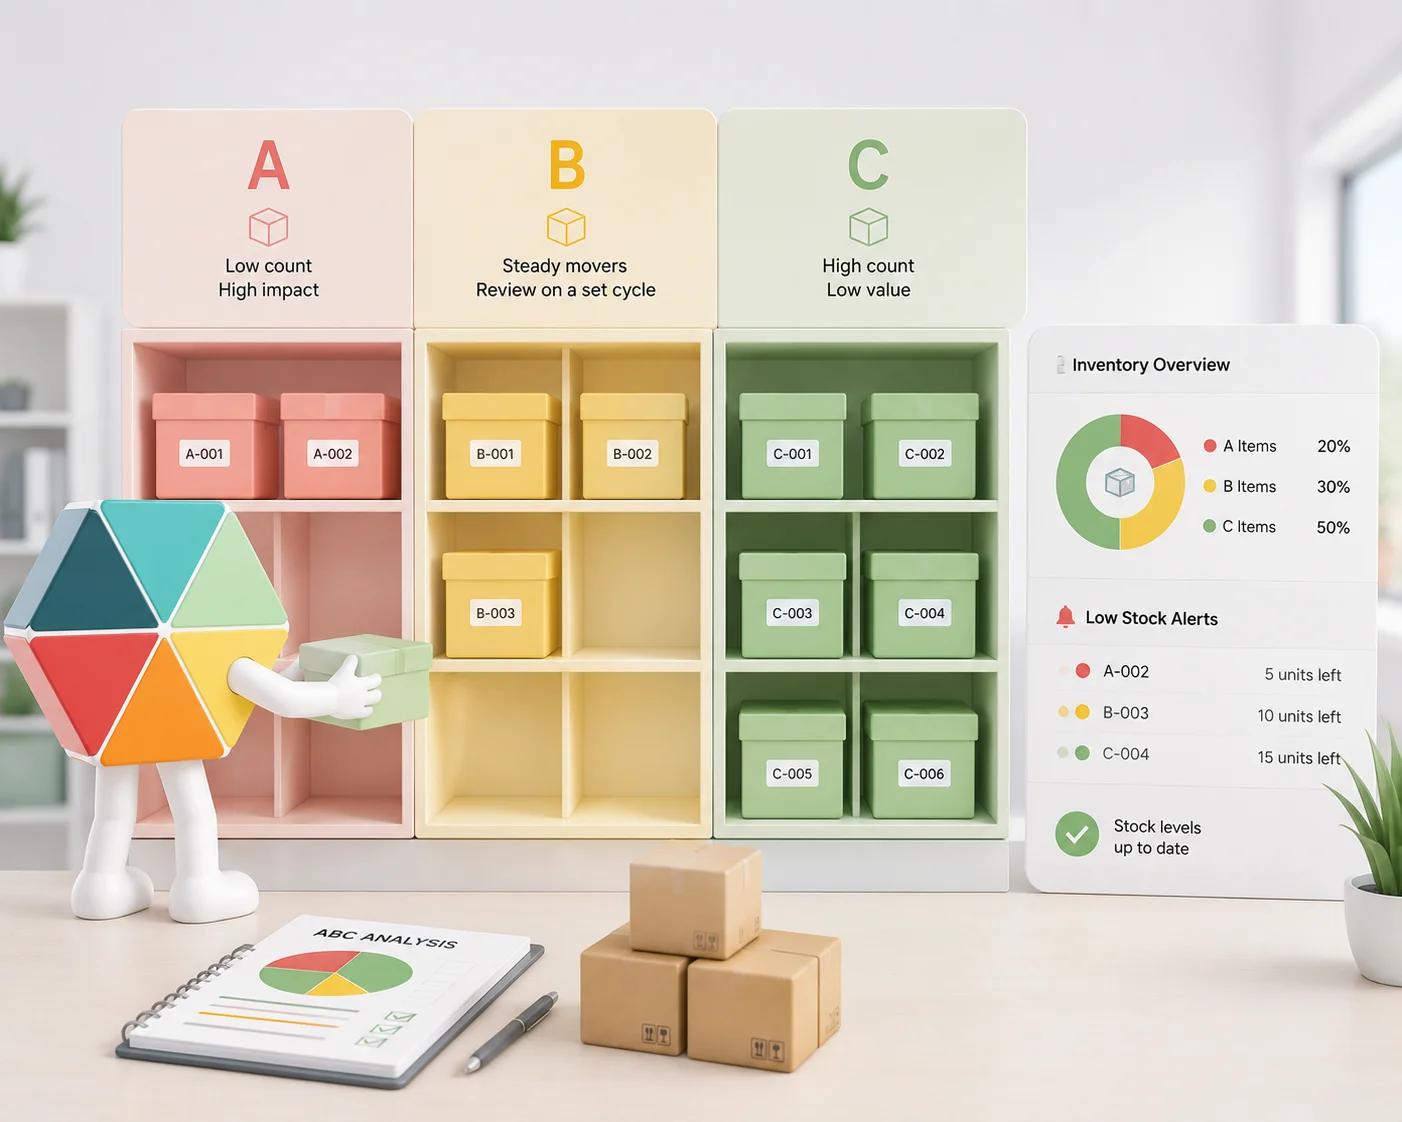
The three categories
A items High value, high priority. Typically 10-20% of total SKUs but account for 70-80% of total inventory value or sales revenue. Reorder frequency is high. Stock monitoring is tight. Safety stock levels are carefully set.
Examples: a core raw material used in every production run, a top-selling product variant, a component with long lead times.
B items Medium value, moderate priority. Usually 30-40% of SKUs, contributing 15-25% of total value. These warrant regular attention but not the same intensity as A items. Reorder cycles are longer. Safety stock is moderate.
Examples: secondary materials used in some product lines, mid-range products, components with reliable supplier relationships.
C items Low value, low priority. Often 40-50% of SKUs but only 5-10% of total value. Managed with a lighter touch - bulk ordering where possible, less frequent review cycles, minimal safety stock.
Examples: consumables, packaging materials, rarely ordered spare parts, slow-moving accessories.
How to Run ABC Analysis Step by Step
Step 1: Pull your full inventory list
Start with every active SKU. Include unit cost, average monthly consumption or sales volume, and current stock on hand.
Step 2: Calculate annual consumption value per SKU
For each item:
Annual consumption value = unit cost x annual units consumed (or sold)
This gives you the total financial weight each SKU carries over a year.
Step 3: Sort by annual consumption value (descending)
Rank your full list from highest to lowest value. This is where the Pareto curve becomes visible.
Step 4: Calculate cumulative percentage
Add a running total column. At each row, calculate what percentage of total inventory value that item and all items above it represent.
Step 5: Assign categories
- Items in the top 0-80% of cumulative value = A
- Items from 80-95% = B
- Items from 95-100% = C
These thresholds are guides, not rules. Adjust based on what makes sense for your operation.
Step 6: Apply different management rules per category
Running the analysis is not the goal. Changing how you manage each tier is the goal.
A Worked Example: Ten SKUs, Classified
Descriptions of the method are easy to find. Actual numbers are not, so here is a small catalogue run all the way through. Ten SKUs from a light manufacturing workshop, sorted by annual consumption value, with the running percentage that decides each tier.
| SKU | Unit cost | Annual units | Annual value | Cumulative % | Class |
|---|---|---|---|---|---|
| Stainless sheet, 2mm | $180 | 420 | $75,600 | 37.0% | A |
| Drive motor, 1.5kW | $340 | 150 | $51,000 | 62.0% | A |
| Hydraulic hose assembly | $95 | 260 | $24,700 | 74.1% | A |
| Bearing set 6205 | $22 | 900 | $19,800 | 83.8% | B |
| Control relay | $48 | 260 | $12,480 | 89.9% | B |
| Cutting fluid, 20L | $65 | 130 | $8,450 | 94.0% | B |
| Filter cartridge | $18 | 340 | $6,120 | 97.0% | C |
| Gasket kit | $12 | 300 | $3,600 | 98.8% | C |
| Cable ties, 100pk | $6 | 240 | $1,440 | 99.5% | C |
| Shop rags, box | $9 | 120 | $1,080 | 100% | C |
Total annual consumption value: $204,270.
Three things in that table are worth pointing at.
The split is 30/30/40, not the textbook 20/30/50. Three A items carry 74% of the value, three B items carry 20%, and four C items carry 6%. Small catalogues rarely land on the tidy ratios in the diagrams, and forcing them to is how teams end up with an A tier that does not match where the money actually sits. The percentages describe what the Pareto curve usually looks like. They are not a target to hit.
The 80% line falls inside a SKU, not between two. Cumulative value goes from 74.1% at the hydraulic hose straight to 83.8% at the bearing set. Nothing lands on 80. You have to decide whether the item that crosses the line goes up or down, and the honest answer is that it depends on lead time and how badly a stockout hurts, not on the arithmetic.
Bearing set 6205 is the interesting row. It is the highest-volume item in the catalogue at 900 units a year, and it still classifies as B, because $22 units do not add up the way $340 motors do. Teams that rank by units moved rather than by value consistently over-manage items like this one and under-manage the two or three that would actually hurt to run out of.
ABC Analysis in Practice: What Changes Per Tier
| A Items | B Items | C Items | |
|---|---|---|---|
| Review frequency | Weekly or continuous | Monthly | Quarterly |
| Reorder method | Reorder point + safety stock | Periodic review | Bulk or on-demand |
| Supplier relationship | Strategic, close contact | Standard | Opportunistic |
| Stock accuracy target | Very high | High | Moderate |
| Low-stock alerts | Always active | Active | Optional |
Using ABC Classes to Set a Cycle Count Schedule
The most common practical use of an ABC classification is deciding how often to physically count each item. A full annual stocktake is disruptive and, by the time it is done, out of date. Cycle counting spreads the work across the year and counts the items that matter more often.
| Class | Count frequency | Counts per item per year | Why |
|---|---|---|---|
| A | Monthly | 12 | Value concentration means a small discrepancy is expensive |
| B | Quarterly | 4 | Enough to catch drift before it compounds |
| C | Annually | 1 | Counting cheap, slow items monthly costs more than the errors it finds |
For the ten-SKU example above, that is 36 A counts, 12 B counts and 4 C counts across the year: 52 line counts total, roughly one a week, instead of one long shutdown. The workload is small enough that a two-person team can absorb it.
Two things break this in practice. The first is that the count schedule is kept somewhere separate from the stock record, so nobody can see at a glance which items are overdue. The second is that a variance found during a count gets corrected in the sheet without any note of what it was before, which means the recurring discrepancies never become visible as a pattern. Both are record-keeping problems rather than counting problems.
Common Mistakes When Applying ABC Classification
Doing it once and never updating it Inventory value shifts over time. A product that was a C item last year may have become a core SKU this year. ABC analysis should be reviewed at minimum quarterly.
Treating it as a fixed rule The 80/95/100 thresholds are starting points. Some operations benefit from tighter A-category definitions. Others split A into A1 and A2 for high-value versus high-frequency items.
Ignoring lead time A C item with a 12-week lead time and no local substitutes may need to be managed more like an A item despite its low value. Cost is one dimension. Supply chain risk is another.
Forgetting to act on it The analysis is only useful if it changes reorder policies, safety stock levels, and alert thresholds. If nothing changes in how the stock is managed, the classification was just an exercise.
How ABC Analysis Connects to Your Broader Inventory System
ABC classification works best when it connects to the rest of your inventory management process.
Reorder points: A items should have clearly defined reorder points based on lead time and consumption rate. If you are not sure how to set those up, this guide on automating inventory alerts in Google Sheets covers the logic.
Valuation method: If you are using FIFO or LIFO for cost tracking, your ABC tiers should reflect the valuation method you use. FIFO vs LIFO for small businesses affects which items carry most financial weight. For a side-by-side look at all three methods together, see inventory management methods: FIFO, JIT, and ABC explained.
Multi-location stock: If you run inventory across more than one site, your ABC classification may differ per location. An A item at your main warehouse might be a C item at a satellite store. Managing that distinction requires a system that tracks stock per location, not just in aggregate.
Does ABC Analysis Work in Google Sheets?
Yes. For most teams with under 500 SKUs it is the right starting point.
Four formulas do the whole thing. Assume column A holds the SKU name, column B the unit cost, column C annual units, and that your data runs from row 2 to row 11.
Annual value      D2:  =B2*C2
Sorted by value        =SORT(A2:D11, 4, FALSE)
Cumulative share  E2:  =SUM($D$2:D2)/SUM($D$2:$D$11)
Class             F2:  =IFS(E2<=0.8, "A", E2<=0.95, "B", TRUE, "C")
Sort by column D descending first, then fill E and F down. The dollar signs in the cumulative formula are what makes it work: the range start is locked to D2 and the end walks down with the row, so each line sums everything above it.
If you want the tier cut-offs to be adjustable rather than baked into the formula, put 0.8 and 0.95 in two named cells and reference those instead. Teams change those numbers more often than they expect to.
The limitation is not the analysis itself. It is what happens after. A spreadsheet can tell you which items are A-tier. It cannot automatically adjust reorder alerts, flag when a C item is approaching stockout, or surface which items have moved tiers since last quarter without manual review.
That gap - between knowing the classification and acting on it in real time - is where structured inventory tools add value.
Fixeets inventory management is built inside Google Sheets and Google Workspace. It handles stock movement tracking, low-stock alerts, and multi-location management for up to 500 SKUs, without moving your team off the tools they already use. ABC logic fits naturally into the way Fixeets structures your inventory data.
When to Move Beyond a Manual ABC System
A manual ABC spreadsheet is a good start. It is not a long-term system for a growing operation.
Signs you need more structure:
- Your team spends time maintaining the classification instead of using it
- Reorder decisions are still based on memory or habit, not tier rules
- A items are running out because nobody checked the alert
- New SKUs are not being classified consistently
At that point, the question is not whether ABC analysis is the right method. It is whether your current tool can support applying it consistently across your full catalogue. See the best inventory management tools for small businesses for a comparison of options built for that scale.
When you are ready to look at options, Fixeets plans are built around teams that have outgrown basic spreadsheets but do not need enterprise ERP software.
ABC analysis is one of several methods covered in our complete inventory management guide, alongside FIFO, safety stock, and how to choose a system that fits your team.
Key Takeaways
- ABC analysis splits inventory into three tiers by value and movement - not by size or quantity
- A items (typically 10-20% of SKUs) drive 70-80% of total inventory value
- B items are mid-range in both volume and value
- C items make up the bulk of SKUs but contribute the least to overall value
- The method works best when reviewed regularly, not set once and forgotten
- It pairs well with reorder point planning and low-stock alert systems
- A spreadsheet handles the calculation well. Acting on it automatically requires more structure
FAQ: ABC Analysis for Inventory
What is ABC analysis in inventory management? ABC analysis is a method of categorizing inventory into three groups - A, B, and C - based on their value and movement rate. A items are high-value and high-priority. C items are low-value and low-priority. It helps teams allocate attention and resources where they matter most.
What does ABC stand for in inventory? The letters do not stand for specific words. They are three categories ranked from highest (A) to lowest (C) importance based on inventory value and consumption.
What is the 80/20 rule in ABC inventory? The 80/20 rule, or Pareto principle, is the foundation of ABC analysis. It suggests that roughly 20% of your SKUs account for 80% of your total inventory value. ABC analysis uses this insight to define your A tier.
How do you calculate ABC analysis? Multiply unit cost by annual consumption for each SKU. Sort the results from highest to lowest. Add a cumulative percentage column. Items in the top 80% of cumulative value are A, 80-95% are B, and 95-100% are C.
How often should you run ABC analysis? At minimum quarterly. For fast-moving inventory or seasonal businesses, monthly reviews are better. The classification should reflect current demand, not last year's patterns.
Can ABC analysis be done in Google Sheets? Yes. The calculation requires basic formulas and sorting. The limitation is what happens after - acting on the classification automatically requires more structure than a standard spreadsheet provides.
What is the difference between ABC analysis and XYZ analysis? ABC analysis categorizes by value. XYZ analysis categorizes by demand variability - X items have stable demand, Z items have unpredictable demand. Some operations combine both methods for a more complete picture.
Is ABC analysis only for large companies? No. It is especially useful for teams managing 50+ SKUs who cannot give equal attention to every item. The simpler your current system, the more immediately useful the classification becomes.
What are the limitations of ABC analysis? It focuses on value and volume but does not account for lead time, supply chain risk, or criticality. A low-cost item that is hard to source may need A-level attention despite being classified as C by value.
How does ABC analysis help reduce stockouts? By concentrating reorder monitoring and safety stock on A items, you reduce the risk of running out of the items that most affect your operations. Stockouts on C items are inconvenient. Stockouts on A items stop production or lose sales.
How often should you cycle count A items? Monthly is the common answer for A items, quarterly for B, and annually for C. The point is that counting effort should follow value concentration, so a small error on a high-value item gets caught quickly while cheap, slow-moving stock is not counted more often than it is worth.
Do A items have to be 20% of my SKUs? No. The 20/30/50 split describes what the Pareto curve usually looks like across a large catalogue, not a target to hit. A ten-SKU or hundred-SKU catalogue often lands somewhere else entirely. Let the cumulative value column decide the tiers and accept whatever SKU counts fall out of it.
What if an item sits right on the 80% line? Real data rarely lands exactly on the cut-off, so one item usually straddles it. Decide by lead time and consequence rather than arithmetic: if the item takes weeks to resupply or stops production when it runs out, move it up to A. If it is easy to source locally, leave it in B.
What is a good tool for ABC inventory analysis? A spreadsheet works for the initial calculation. For ongoing management - alerts, movement tracking, and consistent classification across SKUs - a structured inventory system inside your existing workspace is more reliable.