Inventory turnover ratio is one of the clearest signals of how well a business manages its stock. It tells you how many times your inventory is sold and replaced over a given period. A high ratio generally means stock is moving efficiently. A low ratio often points to overstocking, slow-moving products, or weak demand.
For SMEs and growing operations, tracking this metric is the difference between making stock decisions on instinct and making them on data.
What Is Inventory Turnover Ratio?
Inventory turnover ratio is a financial and operational metric that measures how many times a business sells through its entire inventory within a specific period, typically a year.
The formula is:
Inventory Turnover Ratio = Cost of Goods Sold (COGS) / Average Inventory Value
Where average inventory value is calculated as:
(Opening Inventory + Closing Inventory) / 2
For example: if your COGS for the year is €120,000 and your average inventory value is €20,000, your inventory turnover ratio is 6. That means you sold through your entire stock six times over the course of the year.
What Is a Good Inventory Turnover Ratio?
There is no universal benchmark. The right ratio depends on your industry, product type, and business model.
Fast-moving consumer goods, food products, and high-volume retail operations typically see ratios of 10 or higher. Manufacturing SMEs with longer production cycles or seasonal demand patterns may operate healthily at 4 to 6. Businesses selling high-value, low-volume goods may see ratios of 1 to 3 without it indicating a problem.
The most useful comparison is your own ratio over time. A declining turnover ratio in your specific context is a more meaningful signal than a comparison to an industry average that may not reflect your product mix or market.
Why Inventory Turnover Ratio Matters for SMEs
Cash flow is the practical reason. Stock sitting in a warehouse is capital that is not working. Every day a product stays unsold ties up money that could be used for production, payroll, or growth.
A low inventory turnover ratio is often a symptom of:
- Too much stock ordered relative to actual demand
- Products that are no longer moving as expected
- Poor visibility of what is actually selling versus what is sitting
- Reorder triggers set too high without a clear basis
A high ratio raises a different concern. If inventory turns too fast, you risk stockouts, unfulfilled orders, and reactive purchasing that increases costs. The goal is not the highest possible ratio. It is a ratio that reflects demand accurately while keeping stock levels efficient.
How to Calculate Inventory Turnover Ratio in Practice
For most SMEs, the inputs come from two sources: accounting data for COGS and inventory records for opening and closing stock values.
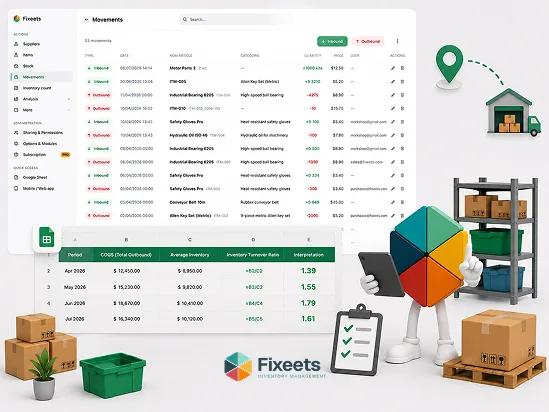
In a Google Sheets-based inventory system, this calculation can be set up as a running metric. If you are logging stock movements and maintaining SKU-level costs, the data needed for the ratio is already in your system. The formula becomes a reference cell rather than a manual calculation.
For businesses not yet tracking COGS consistently, a simpler version uses total sales revenue divided by average inventory value. This gives a less precise result but still surfaces the directional trend, which is what matters most for operational decisions.
Common Reasons for a Low Inventory Turnover Ratio
Overstocking. Ordering in bulk to hit minimum order quantities or to take advantage of supplier discounts can leave excess stock sitting for extended periods. The unit cost saving often does not offset the holding cost and cash tied up.
Poor demand forecasting. Ordering based on last year's sales or gut feel rather than current trends leads to mismatches between stock levels and actual demand.
Slow-moving or obsolete SKUs. Products that once sold well but no longer do will drag down the overall ratio if they remain in the inventory without being addressed.
No visibility across locations. For businesses with stock in multiple locations, a product may appear low at one site while sitting idle at another. Without consolidated visibility, purchasing decisions get made on incomplete information.
No low-stock or overstock alerts. Without automatic signals, imbalances persist until they are noticed manually.
How to Improve Inventory Turnover Ratio
Review your SKU performance regularly
Apply ABC analysis to your product range. A-class items are your high-value, fast-moving SKUs. C-class items are low-value or slow-moving. Inventory decisions should reflect these categories. Reorder frequently for A-class. Review C-class for potential clearance, discontinuation, or renegotiated minimum quantities.
If you have not applied ABC analysis to your inventory yet, the article on ABC analysis for inventory covers how to categorize your stock and what decisions each category should drive.
Tighten reorder points
Reorder points should be based on actual lead time and average daily usage, not on a round number that feels safe. Overstated reorder points result in stock arriving before existing stock has cleared, which compounds the surplus.
The formula for a reorder point is:
(Average Daily Usage x Lead Time in Days) + Safety Stock
This gives you a number grounded in how your operation actually runs, not an approximation. For the full formula breakdown with worked examples, see how to set a reorder point.
Clear slow-moving stock deliberately
Slow-moving stock does not improve on its own. Discounting, bundling with faster-moving products, or returning to suppliers where agreements allow are all more productive than holding the stock and hoping demand returns.
Improve demand visibility
The closer your purchasing decisions are to real demand signals, the more accurate your inventory levels will be. This means tracking actual sales or consumption patterns per SKU, not just looking at aggregate totals.
Reduce stockouts that force reactive ordering
Stockouts drive emergency purchases at higher unit costs and with less favorable terms. They also train buyers to carry more safety stock than necessary as a buffer, which increases average inventory value and depresses the ratio. Fixing the root cause of stockouts, usually a visibility or alerting gap, improves both the ratio and the cost of goods sold over time.
For a closer look at stockout causes and prevention, the article on how to prevent stockouts in retail inventory covers the specific mechanics and how to set up alerts before stock hits zero.
Tracking Inventory Turnover Ratio Inside Fixeets
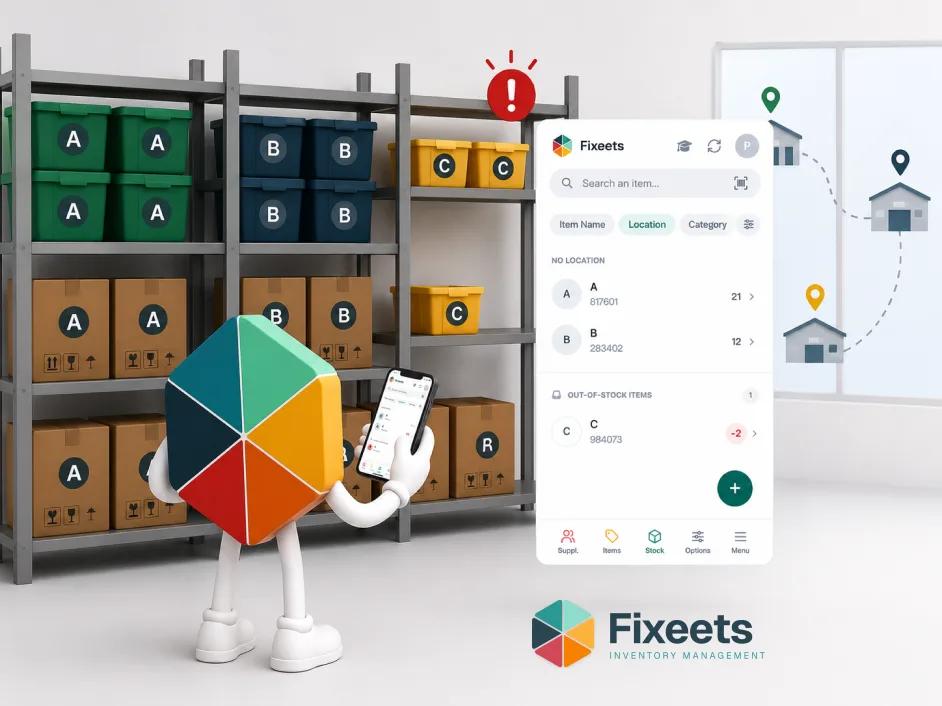
Fixeets tracks stock movements at the SKU level across locations. Every receipt, transfer, and dispatch is logged. This gives you the movement data needed to calculate turnover ratio accurately without manually reconciling spreadsheet entries.
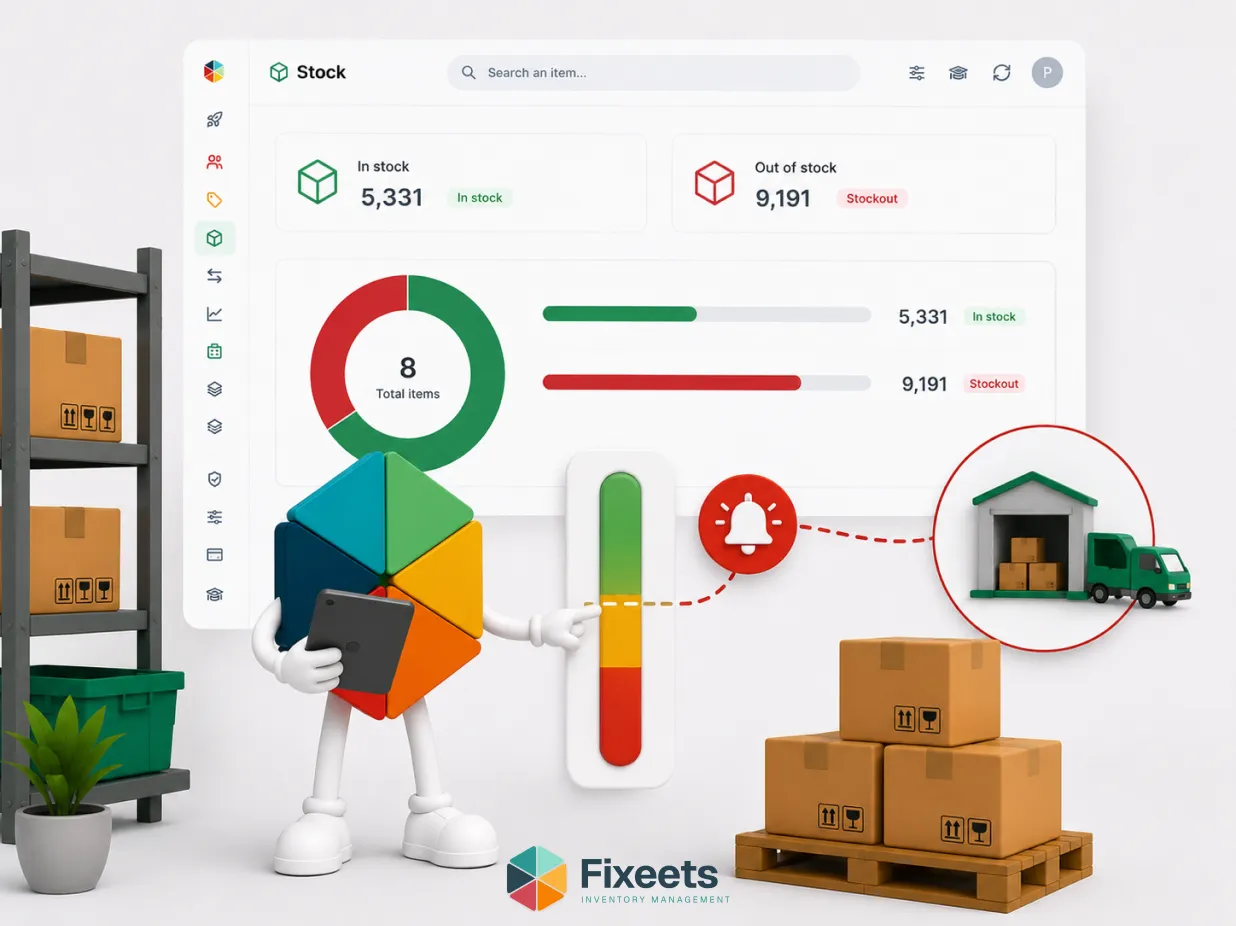
Combined with low-stock alerts and multi-location visibility, Fixeets makes it practical to act on the ratio rather than just calculate it. When a slow-moving SKU is flagged, you can adjust the reorder point directly. When stock across locations is visible in one view, purchasing decisions reflect total inventory rather than a single site.
To see how stock tracking works in practice, visit the Fixeets inventory management page.
Connecting Turnover Ratio to Broader Inventory KPIs
Inventory turnover ratio is one metric in a broader set. It tells you how fast stock moves, but it does not tell you whether the right products are in the right place, whether your reorder points are calibrated, or whether your supplier lead times are creating problems.
For teams building toward a more complete inventory measurement framework, turnover ratio pairs well with:
- Days inventory outstanding (inventory turnover ratio converted to days: 365 / turnover ratio)
- Stockout rate (how often a SKU hits zero before being replenished)
- Carrying cost of inventory (the total cost of holding stock, including storage, insurance, and capital cost)
- Order accuracy rate (the percentage of purchase orders received correctly and on time)
These metrics together give a fuller picture of inventory health than any single number.
For teams also managing equipment and maintenance operations alongside inventory, the article on maintenance management KPIs every operations manager should track covers the operational metrics that sit alongside inventory performance in a structured SME operation.
And for the fundamentals these metrics measure - methods, costing, and how to choose a system - our complete inventory management guide covers the full topic in one place.
Key Takeaways
- Inventory turnover ratio measures how many times stock is sold and replaced in a given period. The formula is COGS divided by average inventory value.
- There is no universal benchmark. The right ratio depends on your industry and product type. Track your own trend over time rather than comparing to generic averages.
- A low ratio usually points to overstocking, slow-moving SKUs, or poor demand visibility. A high ratio can signal stockout risk.
- Improving turnover ratio requires tighter reorder points, regular SKU performance reviews, deliberate clearance of slow-moving stock, and better demand visibility.
- Fixeets tracks movement at SKU level across locations, giving you the data needed to calculate and act on turnover ratio without manual reconciliation.
Frequently Asked Questions
What is inventory turnover ratio? Inventory turnover ratio measures how many times a business sells through its entire inventory over a given period, typically a year. It is calculated by dividing the cost of goods sold by the average inventory value for the same period.
What is a good inventory turnover ratio for an SME? It depends on the industry and product type. Fast-moving retail may see ratios above 10. Manufacturing SMEs with longer cycles may operate at 4 to 6. The most useful benchmark is your own ratio tracked over time, not an industry average.
How do I calculate average inventory value? Add opening inventory value and closing inventory value, then divide by two. If you track inventory monthly, you can average the values across all months in the period for a more accurate figure.
What causes a low inventory turnover ratio? Common causes include overstocking, slow-moving or obsolete SKUs, poor demand forecasting, lack of visibility across locations, and reorder points set too high without a clear basis in actual usage and lead time.
Can inventory turnover ratio be too high? Yes. A very high ratio can indicate insufficient safety stock, which increases the risk of stockouts and emergency purchasing. The goal is a ratio that reflects real demand patterns while keeping inventory levels efficient.
How often should I calculate inventory turnover ratio? Monthly or quarterly tracking gives you enough frequency to spot trends early. An annual calculation is a useful benchmark but too infrequent to inform timely purchasing decisions.
What is days inventory outstanding? Days inventory outstanding converts turnover ratio into days. Divide 365 by the turnover ratio to get the average number of days stock sits before being sold. A turnover ratio of 6 equals approximately 61 days of inventory on hand.
How does Fixeets help improve inventory turnover ratio? Fixeets logs every stock movement at SKU level, making it straightforward to identify slow-moving products, set accurate reorder points, and maintain visibility across locations. This reduces the surplus accumulation and stockout cycles that distort turnover ratio.
What is the difference between inventory turnover ratio and sell-through rate? Inventory turnover ratio uses cost of goods sold and applies to a period. Sell-through rate compares units sold to units received in the same period and is expressed as a percentage. Both measure stock movement but from different angles. Sell-through is more common in retail; turnover ratio is more common in operations and finance.
Does inventory turnover ratio apply to raw materials as well as finished goods? Yes. For manufacturing operations, you can calculate turnover ratio for raw materials, work-in-progress, and finished goods separately. Each gives a different signal about where stock is accumulating or moving efficiently in the production flow.